Title
棰樼洰
UM-Net: Rethinking ICGNet for polyp segmentation with uncertainty modeling
UM-Net: 閲嶆柊鎬濊€冪敤浜庢伅鑲夊垎鍓茬殑ICGNet锛岀粨鍚堜笉纭畾鎬у缓妯?/p>
01
鏂囩尞閫熼€掍粙缁?/strong>
缁撶洿鑲犵檶锛圕RC锛夋槸鐢锋€т腑绗笁澶с€佸コ鎬т腑绗簩澶у父瑙佺殑鎭舵€ц偪鐦わ紝2020骞寸害鏈変竴鐧句竾渚嬫柊鍙戠梾渚嬶紝鍗犲叏鐞冪檶鐥囨浜$殑9.4%锛圫ung绛夛紝2021锛夈€?5%鐨勭粨鐩磋偁鐧屾簮浜庣粨鐩磋偁鑵虹槫鎬ф伅鑲夛紝鐗瑰埆鏄珮鍗辫吅鐦わ紙Strum鍜學illiamson锛?016锛夈€傚垢杩愮殑鏄紝濡傛灉鑳藉湪缁撹偁鐧屽彂鐢熷墠鍙婃椂妫€娴嬪苟鍒囬櫎缁撶洿鑲犳伅鑲夛紝CRC鐨勫彂鐥呯巼鍜屾浜$巼鍙互寰楀埌鏈夋晥闄嶄綆锛?骞寸敓瀛樼巼鍙揪90%锛圫iegel绛夛紝2021锛夈€傚湪涓村簥瀹炶返涓紝楂樿川閲忕殑缁撹偁闀滄鏌ユ槸绛涙煡鍜屽垏闄ょ粨鐩磋偁鎭倝鐨勬渶浣虫柟娉曪紝骞惰瑙嗕负閲戞爣鍑嗭紝鑳藉鎻愪緵鎭倝鐨勪綅缃拰澶栬淇℃伅銆傜劧鑰岋紝杩欎竴杩囩▼閫氬父鐢卞唴闀滃尰鐢熸墜鍔ㄨ繘琛岋紝鍙兘鍙楀埌浜轰负涓昏鍥犵礌鐨勫奖鍝嶏紝鍥犳伅鑲夌殑澶氭牱鎬ц€屽鑷存紡璇娿€備竴浜涚爺绌惰〃鏄庯紝缁撹偁闀滄鏌ヤ腑鎭倝婕忚瘖鐜囬珮杈?1.4%锛圞im绛夛紝2017锛夈€傚洜姝わ紝杩垏闇€瑕佷竴绉嶈嚜鍔ㄤ笖鍙潬鐨勬伅鑲夊垎鍓叉柟娉曪紝浠ヨ緟鍔╁尰鐢熷湪璇婃柇杩囩▼涓畾浣嶆伅鑲夊尯鍩熴€?/p>
鍦ㄤ笉鍚岀殑鍙戣偛闃舵锛岀粨鐩磋偁鎭倝鐨勭粨鏋勫拰鐗瑰緛浼氶殢鏃堕棿鍙樺寲锛圝ha绛夛紝2021锛夈€傛伅鑲夌殑澶у皬涓嶄竴銆佸舰鐘朵笉瑙勫垯銆侀鑹插拰澶栬鍚勫紓锛岃繖浣垮緱鍏跺垎鏋愬叿鏈夋寫鎴樻€с€傛澶栵紝涓€浜涘洜绱犲彲鑳戒細瀵艰嚧鍒嗗壊杩囩▼涓殑閿欒锛屽鍥惧儚涓殑姘存祦銆佽偁閬撳唴瀹圭墿銆佹ā绯娿€佹皵娉″拰浜害鍙樺寲绛変吉褰憋紙Wu绛夛紝2021锛夈€?/p>
Abatract
鎽樿
Automatic segmentation of polyps from colonoscopy images plays a critical role in the early diagnosis andtreatment of colorectal cancer. Nevertheless, some bottlenecks still exist. In our previous work, we mainlyfocused on polyps with intra-class inconsistency and low contrast, using ICGNet to solve them. Due to thedifferent equipment, specific locations and properties of polyps, the color distribution of the collected images isinconsistent. ICGNet was designed primarily with reverse-contour guide information and local鈥揼lobal contextinformation, ignoring this inconsistent color distribution, which leads to overfitting problems and makes itdifficult to focus only on beneficial image content. In addition, a trustworthy segmentation model should notonly produce high-precision results but also provide a measure of uncertainty to accompany its predictionsso that physicians can make informed decisions. However, ICGNet only gives the segmentation result andlacks the uncertainty measure. To cope with these novel bottlenecks, we further extend the original ICGNetto a comprehensive and effective network (UM-Net) with two main contributions that have been proved byexperiments to have substantial practical value. Firstly, we employ a color transfer operation to weaken therelationship between color and polyps, making the model more concerned with the shape of the polyps.Secondly, we provide the uncertainty to represent the reliability of the segmentation results and use varianceto rectify uncertainty. Our improved method is evaluated on five polyp datasets, which shows competitiveresults compared to other advanced methods in both learning ability and generalization capability.
缁撹偁闀滃浘鍍忎腑鎭倝鐨勮嚜鍔ㄥ垎鍓插湪缁撶洿鑲犵檶鐨勬棭鏈熻瘖鏂拰娌荤枟涓捣鐫€鍏抽敭浣滅敤銆傜劧鑰岋紝浠嶇劧瀛樺湪涓€浜涚摱棰堥棶棰樸€傚湪鎴戜滑涔嬪墠鐨勫伐浣滀腑锛屼富瑕侀拡瀵圭被鍐呬笉涓€鑷村拰浣庡姣斿害鐨勬伅鑲夛紝浣跨敤浜咺CGNet鏉ヨВ鍐宠繖浜涢棶棰樸€傜敱浜庝笉鍚岀殑璁惧銆佹伅鑲夌殑鍏蜂綋浣嶇疆鍜岀壒鎬э紝鏀堕泦鍒扮殑鍥惧儚鐨勯鑹插垎甯冧笉涓€鑷淬€侷CGNet涓昏閫氳繃鍙嶅悜杞粨寮曞淇℃伅鍜屽眬閮?鍏ㄥ眬涓婁笅鏂囦俊鎭潵璁捐锛屼絾蹇借浜嗚繖绉嶄笉涓€鑷寸殑棰滆壊鍒嗗竷锛屽鑷翠簡杩囨嫙鍚堥棶棰橈紝浣垮緱妯″瀷闅句互浠呬笓娉ㄤ簬鏈夌敤鐨勫浘鍍忓唴瀹广€傛澶栵紝涓€涓彲淇$殑鍒嗗壊妯″瀷涓嶄粎搴旇浜х敓楂樼簿搴︾殑缁撴灉锛岃繕搴旀彁渚涗笉纭畾鎬у害閲忥紝浠ヤ究鍖荤敓鑳藉鍋氬嚭鏇存湁鏍规嵁鐨勫喅绛栥€傜劧鑰岋紝ICGNet浠呯粰鍑轰簡鍒嗗壊缁撴灉锛岀己涔忎笉纭畾鎬у害閲忋€備负浜嗚В鍐宠繖浜涙柊鍑虹幇鐨勭摱棰堬紝鎴戜滑杩涗竴姝ユ墿灞曚簡鍘熸湁鐨処CGNet锛屾彁鍑轰簡涓€涓患鍚堜笖鏈夋晥鐨勭綉缁滐紙UM-Net锛夛紝骞堕€氳繃瀹為獙楠岃瘉浜嗗叾鍏锋湁鏄捐憲鐨勫疄闄呬环鍊笺€傞鍏堬紝鎴戜滑閲囩敤浜嗛鑹茶浆绉绘搷浣滐紝浠ュ墛寮遍鑹蹭笌鎭倝涔嬮棿鐨勫叧绯伙紝浣挎ā鍨嬫洿鍔犲叧娉ㄦ伅鑲夌殑褰㈢姸銆傚叾娆★紝鎴戜滑鎻愪緵浜嗕笉纭畾鎬ф潵琛ㄧず鍒嗗壊缁撴灉鐨勫彲闈犳€э紝骞朵娇鐢ㄦ柟宸潵淇涓嶇‘瀹氭€с€傛垜浠敼杩涚殑鏂规硶鍦ㄤ簲涓伅鑲夋暟鎹泦涓婅繘琛屼簡璇勪及锛屼笌鍏朵粬鍏堣繘鏂规硶鐩告瘮锛屽湪瀛︿範鑳藉姏鍜屾硾鍖栬兘鍔涙柟闈㈣〃鐜板嚭绔炰簤鍔涖€?/p>
Method
鏂规硶
3.1. Problem definition
Let 饾憞 = {(饾憢饾憱 , 饾憣饾憱 )}饾憗饾憱=1 represent the 饾憗 labeled set, where each pair( 饾憢饾憱 , 饾憣饾憱 ) consists of an image 饾憢饾憱 鈭?R饾惗脳饾惢脳饾憡 and its correspondingground truth 饾憣饾憱 鈭?{0, 1} 饾惢脳饾憡 , where 饾惢 脳 饾憡 are spatial dimensions and饾惗 is the number of channels. As discussed in the introduction, the aim isto train a segmentation network 饾惞饾憼饾憭饾憯 under solving the polyp color anduncertainty problem to obtain good performance on the test data. Inthis work, given two inputs 饾憢1 饾憥 and 饾憢2 饾憦 , the color 饾憦 of 饾憢2 饾憦 is transferredto 饾憢1 饾憥 to get the new input 饾憢1 饾憦 , which constitute the segmentationnetwork 饾惞饾憼饾憭饾憯 ( 饾憢1 饾憦 ) . We also model uncertainty in the prediction results饾憟饾憼饾憥饾懀饾憯 ( 饾惞饾憼饾憭饾憯 ( 饾憢1 饾憦 )), with 饾憼 鈭?[0, 4], while minimizing the prediction bias饾憠 饾憥饾憻 ( 饾惞饾憼饾憭饾憯 ( 饾憢1 饾憦 ) , 饾憣 1 )
3.1 闂瀹氫箟
璁?饾憞 = {(饾憢饾憱 , 饾憣饾憱 )}饾憗饾憱=1 浠h〃 饾憗 涓凡鏍囨敞鐨勬暟鎹泦锛屽叾涓瘡涓€瀵?( 饾憢饾憱 , 饾憣饾憱 ) 鍖呭惈涓€涓浘鍍?饾憢饾憱 鈭?R饾惗脳饾惢脳饾憡 鍙婂叾瀵瑰簲鐨勭湡瀹炴爣绛?饾憣饾憱 鈭?{0, 1} 饾惢脳饾憡锛屽叾涓?饾惢 脳 饾憡 涓虹┖闂寸淮搴︼紝饾惗 琛ㄧず閫氶亾鏁般€傚鍓嶆枃鎵€杩帮紝鎴戜滑鐨勭洰鏍囨槸鍦ㄨВ鍐虫伅鑲夐鑹插拰涓嶇‘瀹氭€ч棶棰樼殑鍚屾椂锛岃缁冧竴涓垎鍓茬綉缁?饾惞饾憼饾憭饾憯锛屼互鍦ㄦ祴璇曟暟鎹笂鑾峰緱鑹ソ鐨勮〃鐜般€傚湪鏈伐浣滀腑锛岀粰瀹氫袱涓緭鍏?饾憢1 饾憥 鍜?饾憢2 饾憦锛屽皢 饾憢2 饾憦 鐨勯鑹?饾憦 杞崲鍒?饾憢1 饾憥锛屽緱鍒版柊鐨勮緭鍏?饾憢1 饾憦锛岀劧鍚庤緭鍏ュ埌鍒嗗壊缃戠粶 饾惞饾憼饾憭饾憯 ( 饾憢1 饾憦 )銆傛垜浠繕瀵归娴嬬粨鏋滅殑涓嶇‘瀹氭€?饾憟饾憼饾憥饾懀饾憯 ( 饾惞饾憼饾憭饾憯 ( 饾憢1 饾憦 )) 杩涜寤烘ā锛岎潙?鈭?[0, 4]锛屽苟涓斿湪鏈€灏忓寲棰勬祴鍋忓樊 饾憠饾憥饾憻 ( 饾惞饾憼饾憭饾憯 ( 饾憢1 饾憦 ), 饾憣* 1 ) 鐨勫悓鏃惰繘琛屼紭鍖栥€?/p>
Results
缁撴灉
5.1. Quantitative evaluation for metric superiority
5.1.1. Learning ability
In this section, we perform the learning ability of our approachon two datasets, and the quantitative results are shown in Tables 2and 3. Compared with ICGNet, UM-Net has improved the Dice andmIoU metrics from 87.93%, 89.56% to 89.26%, and 90.33% respectively on the EndoScene dataset, and from 92.35%, 91.99% to 93.04%,and 92.54% respectively on the Kvasir-SEG dataset. Similarly, ourmethod is superior to other advanced approaches and achieves the bestperformance, further demonstrating good model learning ability.In addition, we also conduct the complexity analysis comparingour method with other advanced methods. The indicators we compare include floating point operations (FLOPs), network parameters(Params), and frames per second (FPS). On the EndoScene dataset,the FLOPs, Params, and FPS of the UM-Net are 16.87G, 22.75M, and46 respectively, meanwhile achieving 15.62G, 22.75M, and 50 on theKvasir-SEG dataset. Although Polyp-PVT obtains the minimum valuein FLOPs, our method only increases 8.28G, and 7.66G on the twodatasets, respectively. In terms of Params, our model has fewer networkparameters than most advanced methods. Since the accuracy of polypsegmentation is crucial for physicians to produce accurate diagnosticresults, we pay more attention to the accuracy of segmentation withlittle difference in model computational complexity. Therefore, UM-Netis still considered to be the optimal model with reasonable efficiency.It is worth noting that the inference speed of our model can reachan average of 48 FPS, which can be used as an auxiliary system fordiagnosis to satisfy real-time prediction.
5.1. 瀹氶噺璇勪及鎸囨爣鐨勪紭瓒婃€?/p>
5.1.1. 瀛︿範鑳藉姏
鍦ㄦ湰鑺備腑锛屾垜浠涓や釜鏁版嵁闆嗚繘琛屼簡瀛︿範鑳藉姏鐨勮瘎浼帮紝瀹氶噺缁撴灉濡傝〃2鍜岃〃3鎵€绀恒€備笌ICGNet鐩告瘮锛孶M-Net鍦‥ndoScene鏁版嵁闆嗕笂鐨凞ice绯绘暟鍜宮IoU锛堝钩鍧囦氦骞舵瘮锛夊垎鍒粠87.93%銆?9.56%鎻愬崌鑷?9.26%鍜?0.33%锛屽湪Kvasir-SEG鏁版嵁闆嗕笂鐨凞ice绯绘暟鍜宮IoU鍒嗗埆浠?2.35%銆?1.99%鎻愬崌鑷?3.04%鍜?2.54%銆傚悓鏍凤紝鎴戜滑鐨勬柟娉曚紭浜庡叾浠栧厛杩涚殑鏂规硶锛屽苟鍙栧緱浜嗘渶浣虫€ц兘锛岃繘涓€姝ヨ瘉鏄庝簡妯″瀷鑹ソ鐨勫涔犺兘鍔涖€?/p>
姝ゅ锛屾垜浠繕杩涜浜嗗鏉傚害鍒嗘瀽锛屽皢鎴戜滑鐨勬柟娉曚笌鍏朵粬鍏堣繘鏂规硶杩涜姣旇緝銆傛垜浠瘮杈冪殑鎸囨爣鍖呮嫭娴偣杩愮畻娆℃暟锛團LOPs锛夈€佺綉缁滃弬鏁帮紙Params锛夊拰姣忕甯ф暟锛團PS锛夈€傚湪EndoScene鏁版嵁闆嗕笂锛孶M-Net鐨凢LOPs銆丳arams鍜孎PS鍒嗗埆涓?6.87G銆?2.75M鍜?6锛涘湪Kvasir-SEG鏁版嵁闆嗕笂锛屽畠浠垎鍒负15.62G銆?2.75M鍜?0銆傚敖绠olyp-PVT鍦‵LOPs涓婂彇寰椾簡鏈€灏忓€硷紝鎴戜滑鐨勬柟娉曚粎鍒嗗埆鍦ㄤ袱涓暟鎹泦涓婂鍔犱簡8.28G鍜?.66G銆傚湪Params鏂归潰锛屾垜浠殑妯″瀷鎷ユ湁姣斿ぇ澶氭暟鍏堣繘鏂规硶鏇村皯鐨勭綉缁滃弬鏁般€傜敱浜庢伅鑲夊垎鍓茬殑鍑嗙‘鎬у浜庡尰鐢熺敓鎴愮簿纭殑璇婃柇缁撴灉鑷冲叧閲嶈锛屽洜姝ゆ垜浠洿娉ㄩ噸鍒嗗壊鐨勫噯纭€э紝鑰屾ā鍨嬭绠楀鏉傚害鐨勫樊寮傜浉瀵硅緝灏忋€傚洜姝わ紝UM-Net浠嶈璁や负鏄叿鏈夊悎鐞嗘晥鐜囩殑鏈€浣虫ā鍨嬨€?/p>
鍊煎緱娉ㄦ剰鐨勬槸锛屾垜浠ā鍨嬬殑鎺ㄧ悊閫熷害骞冲潎鍙互杈惧埌48 FPS锛岃繖浣垮叾鍙互浣滀负杈呭姪璇婃柇绯荤粺锛屾弧瓒冲疄鏃堕娴嬬殑闇€姹傘€?/p>
Figure
鍥?/strong>
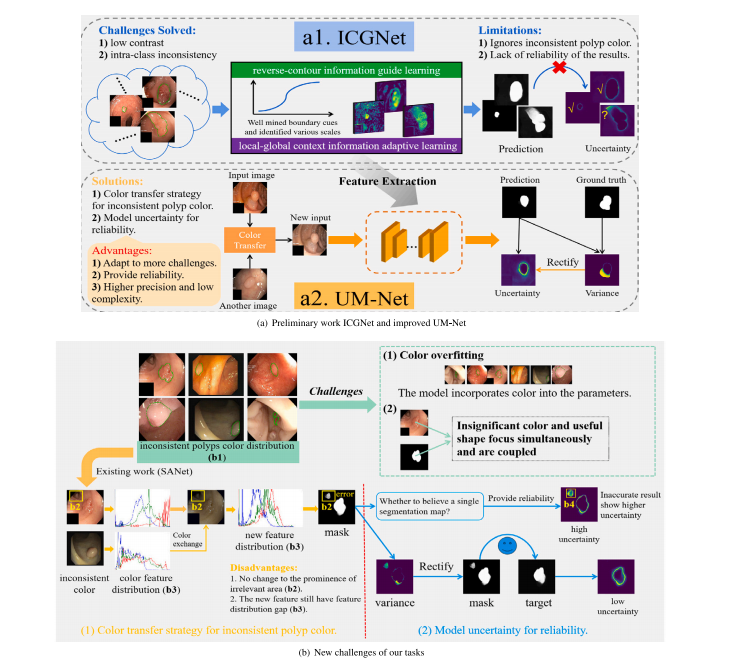
Fig. 1. Challenges and method of our framework to handle the polyps segmentation via using the colonoscopy images. From (a) to (b), they are preliminary work ICGNet and improved method UM-Net, the new challenges of our tasks, respectively
鍥?1. 鎴戜滑妗嗘灦澶勭悊閫氳繃缁撹偁闀滃浘鍍忚繘琛屾伅鑲夊垎鍓茬殑鎸戞垬涓庢柟娉曘€備粠 (a) 鍒?(b)锛屽垎鍒槸鍒濇宸ヤ綔ICGNet鍜屾敼杩涙柟娉昒M-Net锛屼互鍙婃垜浠换鍔¢潰涓寸殑鏂版寫鎴樸€?/p>
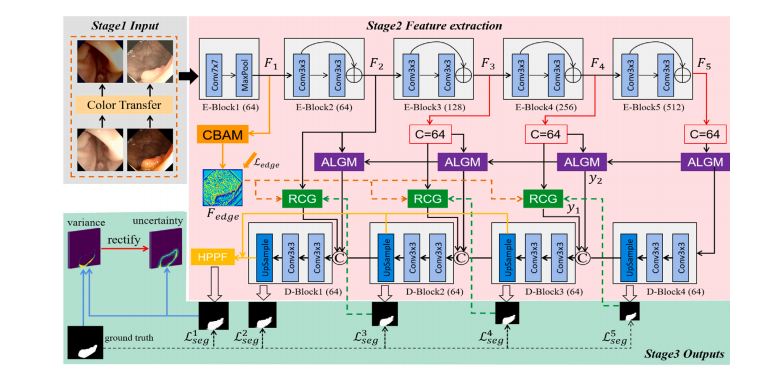
Fig. 2. Overview of the improved UM-Net. It segments the polyps and consists of three stages. Stage1 Input: By using the new polyp images after the color transfer operationas input. Stage2 Feature extraction. Stage3 Outputs: Output segmentation mask as well as corresponding uncertainty. Specifically, the RCG, ALGM, and聽HPPF modules refer toICGNet (Du et al., 2022)
鍥?2. 鏀硅繘鍚庣殑UM-Net姒傝堪銆傝缃戠粶鐢ㄤ簬鎭倝鍒嗗壊锛屽寘鍚笁涓樁娈点€傞樁娈? 杈撳叆锛氶€氳繃棰滆壊杞崲鎿嶄綔鍚庣殑鏂版伅鑲夊浘鍍忎綔涓鸿緭鍏ャ€傞樁娈? 鐗瑰緛鎻愬彇銆傞樁娈? 杈撳嚭锛氳緭鍑哄垎鍓叉帺鐮佸強鐩稿簲鐨勪笉纭畾鎬с€傜壒鍒湴锛孯CG銆丄LGM鍜孒PPF妯″潡鍙傝€冧簡ICGNet锛圖u绛夛紝2022锛夈€?/p>
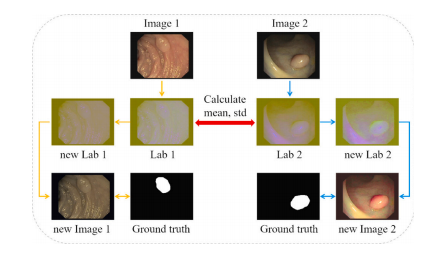
Fig. 3. One iteration of the color transfer operation.
鍥?3. 棰滆壊杞崲鎿嶄綔鐨勪竴娆¤凯浠f祦绋嬨€?/p>
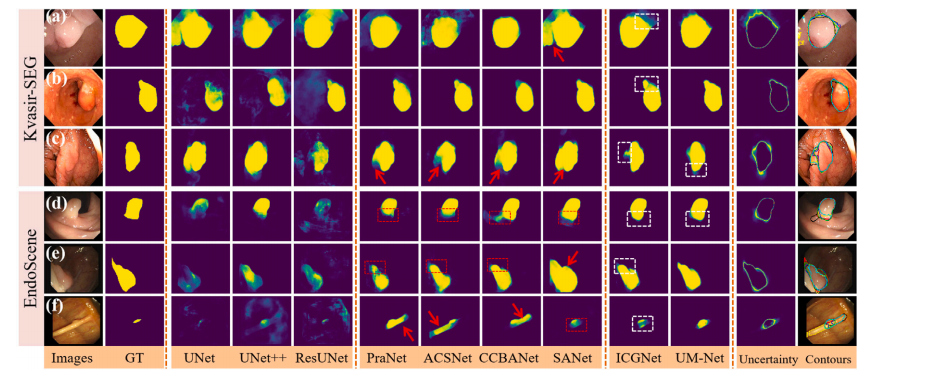
Fig. 4. Qualitative results of different methods on Kvasir-SEG and EndoScene datasets. The segmentation results are converted to contours and shown in the last column (groundtruth in red, PraNet in cyan, ACSNet in yellow, CCBANet in black, SANet in white, ICGNet in blue, UM-Net in green). In addition, the red dashed boxes indicate the misseddiagnosis area, the red arrows indicate areas that are larger than the ground truth, and the white dashed boxes show the difference between ICGNet and UM-Net predictions.
鍥?4. 涓嶅悓鏂规硶鍦↘vasir-SEG鍜孍ndoScene鏁版嵁闆嗕笂鐨勫畾鎬х粨鏋溿€傚垎鍓茬粨鏋滆杞崲涓鸿疆寤撳苟鏄剧ず鍦ㄦ渶鍚庝竴鍒楋紙绾㈣壊涓虹湡瀹炲€硷紝闈掕壊涓篜raNet锛岄粍鑹蹭负ACSNet锛岄粦鑹蹭负CCBANet锛岀櫧鑹蹭负SANet锛岃摑鑹蹭负ICGNet锛岀豢鑹蹭负UM-Net锛夈€傛澶栵紝绾㈣壊铏氱嚎妗嗚〃绀烘紡璇婂尯鍩燂紝绾㈣壊绠ご鎸囩ず澶т簬鐪熷疄鍊肩殑鍖哄煙锛岀櫧鑹茶櫄绾挎鏄剧ずICGNet鍜孶M-Net棰勬祴缁撴灉涔嬮棿鐨勫樊寮傘€?/p>
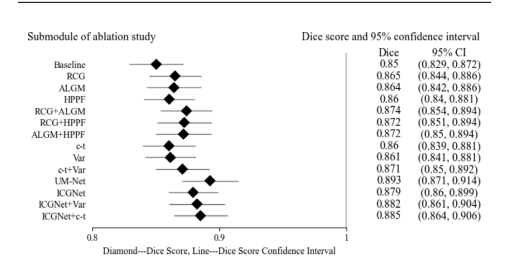
Fig. 5. Forest plot of ablation study on the EndoScene test set. Listed on the leftside are the submodules of the ablation study. On the right side are the submodulescorresponding Dice scores and 95% confidence intervals, and in the middle are theirvisual results, where diamond represents the Dice score of each submodule, and thehorizontal line connecting the diamond represents the upper and lower limits of thescore confidence interval
鍥?5. EndoScene娴嬭瘯闆嗕笂娑堣瀺瀹為獙鐨勬.鏋楀浘銆傚乏渚у垪鍑烘秷铻嶅疄楠岀殑鍚勪釜瀛愭ā鍧楋紝鍙充晶涓哄悇瀛愭ā鍧楀搴旂殑Dice鍒嗘暟鍙?5%缃俊鍖洪棿锛屼腑闂翠负瀹冧滑鐨勫彲瑙嗗寲缁撴灉锛屽叾涓彵褰唬琛ㄦ瘡涓瓙妯″潡鐨凞ice鍒嗘暟锛岃繛鎺ヨ彵褰㈢殑姘村钩绾胯〃绀鸿鍒嗘暟缃俊鍖洪棿鐨勪笂涓嬮檺銆?/p>
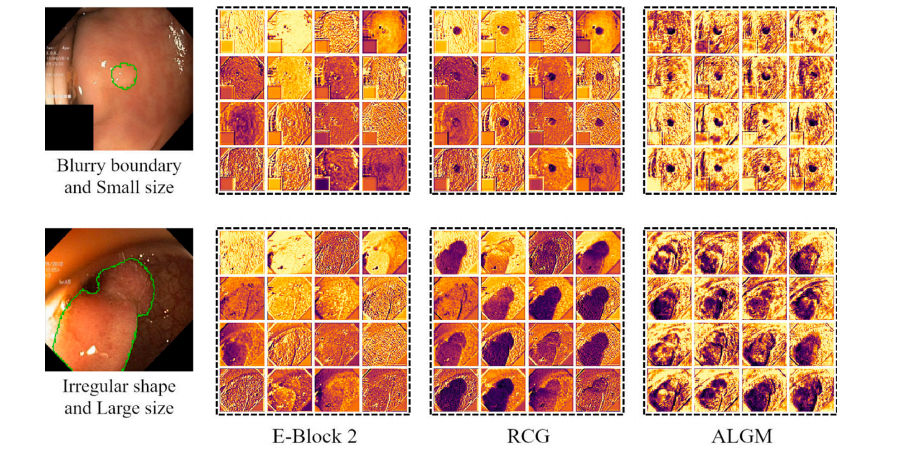
Fig. 6. Feature visualization examples of the UM-Net鈥檚 second layer. From left to right are input images (the green curve represents the outline of ground truth), the E-Block 2feature, the RCG module feature, and the ALGM module feature, respectively. After applying two modules, the network well captured missing object parts and details near theboundary, and achieved feature representation.
鍥?6. UM-Net绗簩灞傜壒寰佸彲瑙嗗寲绀轰緥銆備粠宸﹀埌鍙冲垎鍒负杈撳叆鍥惧儚锛堢豢鑹叉洸绾胯〃绀虹湡瀹炶疆寤擄級銆丒-Block 2鐗瑰緛銆丷CG妯″潡鐗瑰緛鍜孉LGM妯″潡鐗瑰緛銆傚湪搴旂敤杩欎袱涓ā鍧楀悗锛岀綉缁滃緢濂藉湴鎹曟崏鍒颁簡缂哄け鐨勭墿浣撻儴鍒嗗拰杈圭晫闄勮繎鐨勭粏鑺傦紝骞跺疄鐜颁簡鐗瑰緛琛ㄨ揪銆?/p>
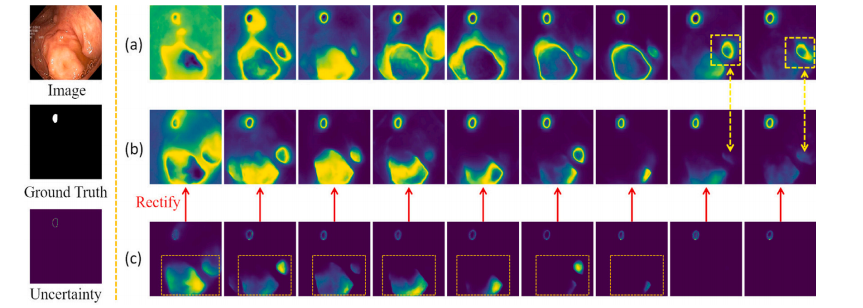
Fig. 7. Shows the variation of UM-Net modeling uncertainty as the number of training iterations continues to increase. From top to bottom on the left are the input images,the ground truth, and the corresponding uncertainty. Row (a) denotes the uncertainty output without variance rectification. Row (b) denotes the uncertainty results of variancerectification. Row (c) denotes the variance calculated between the prediction masks and the ground truth
鍥?7. 鏄剧ず浜嗛殢鐫€璁粌杩唬娆℃暟鐨勫鍔狅紝UM-Net寤烘ā涓嶇‘瀹氭€х殑鍙樺寲鎯呭喌銆傚乏渚т粠涓婂埌涓嬪垎鍒负杈撳叆鍥惧儚銆佺湡瀹炲€煎強鍏跺搴旂殑涓嶇‘瀹氭€с€?a)琛岃〃绀烘湭缁忚繃鏂瑰樊淇鐨勪笉纭畾鎬ц緭鍑恒€?b)琛岃〃绀虹粡杩囨柟宸慨姝g殑涓嶇‘瀹氭€х粨鏋溿€?c)琛岃〃绀洪娴嬫帺鐮佷笌鐪熷疄鍊间箣闂磋绠楃殑鏂瑰樊銆?/p>
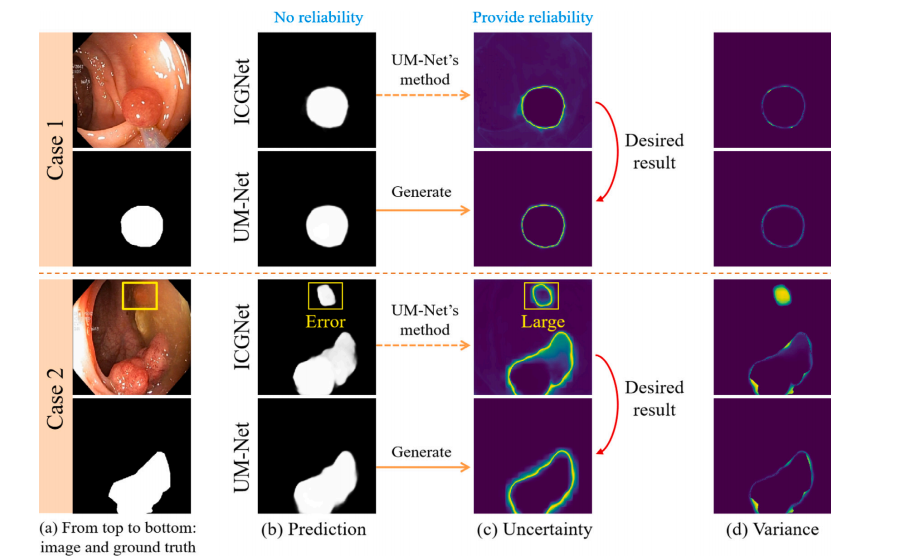
Fig. 8. Provide an evaluation of the reliability degree of the result of two cases in the test set. For each case, from left to right, the first column is the input image and itscorresponding ground truth. The second column displays the prediction for the ICGNet and UM-Net. The third column displays the uncertainty map associated with the predictionfor both models. The last column displays the variance.
鍥?8. 瀵规祴璇曢泦涓袱涓渚嬬殑缁撴灉鍙潬鎬ц繘琛岃瘎浼般€傚浜庢瘡涓渚嬶紝浠庡乏鍒板彸锛岀涓€鍒楁槸杈撳叆鍥惧儚鍙婂叾瀵瑰簲鐨勭湡瀹炲€笺€傜浜屽垪鏄剧ずICGNet鍜孶M-Net鐨勯娴嬬粨鏋溿€傜涓夊垪鏄剧ず涓庤繖涓ょ妯″瀷棰勬祴鐩稿叧鐨勪笉纭畾鎬у浘銆傛渶鍚庝竴鍒楁樉绀烘柟宸浘銆?/p>
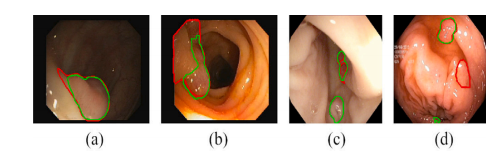
Fig. 9. Failure cases in EndoScene (a, b) and Kvasir-SEG (c, d) datasets. Green and red contours outline our prediction and ground truth of the polyp boundary
鍥?9. EndoScene (a, b) 鍜?Kvasir-SEG (c, d) 鏁版嵁闆嗕腑鐨勫け璐ユ渚嬨€傜豢鑹插拰绾㈣壊杞粨鍒嗗埆鍕惧嫆鍑烘垜浠殑棰勬祴缁撴灉鍜屾伅鑲夎竟鐣岀殑鐪熷疄鍊笺€?/p>
Table
琛?/strong>
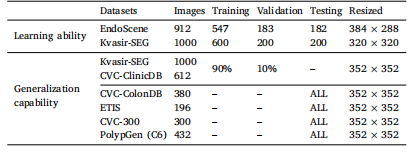
Table 1Details of the datasets for training, validation and testing.
琛?1鐢ㄤ簬璁粌銆侀獙璇佸拰娴嬭瘯鐨勬暟鎹泦璇︽儏銆?/p>
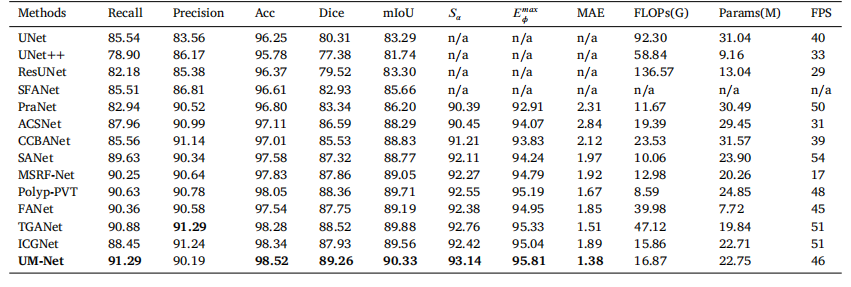
Table 2Quantitative results of the EndoScene test datasets. 鈥榥/a鈥?denotes that the results are not available.
琛?2EndoScene娴嬭瘯鏁版嵁闆嗙殑瀹氶噺缁撴灉銆傗€渘/a鈥濊〃绀虹粨鏋滀笉鍙敤銆?/p>
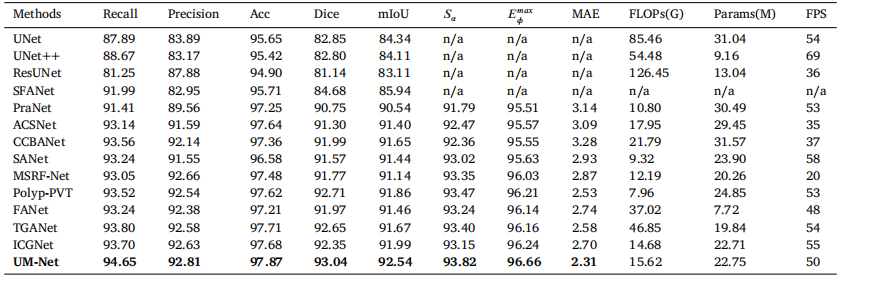
Table 3Quantitative results of the Kvasir-SEG test datasets. 鈥榥/a鈥?denotes that the results are not available.
琛?3Kvasir-SEG娴嬭瘯鏁版嵁闆嗙殑瀹氶噺缁撴灉銆傗€渘/a鈥濊〃绀虹粨鏋滀笉鍙敤銆?/p>
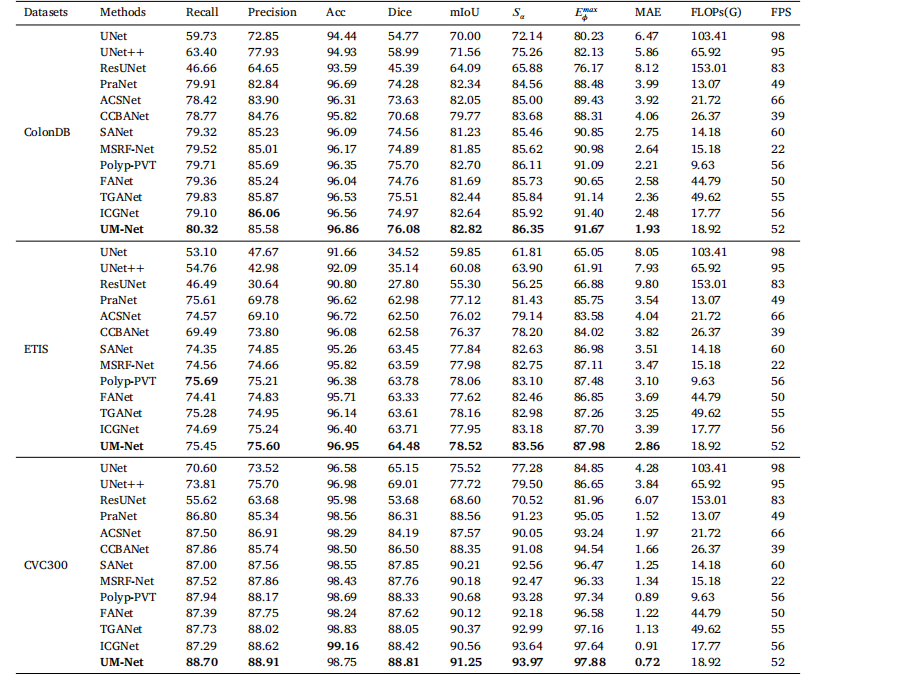
Table 4Quantitative results of the test datasets ColonDB, ETIS and CVC300.
琛?4ColonDB銆丒TIS鍜孋VC300娴嬭瘯鏁版嵁闆嗙殑瀹氶噺缁撴灉銆?/p>
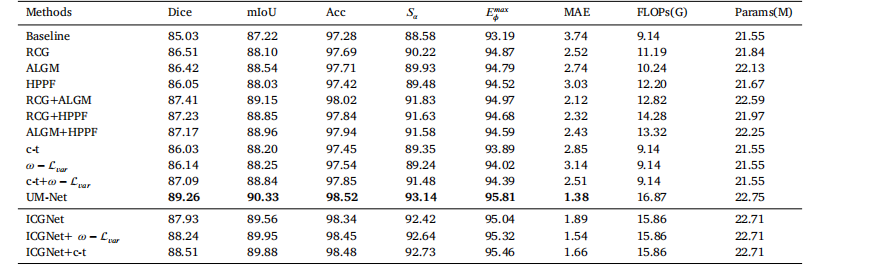
Table 5The quantitative evaluation of the ablation studies on the EndoScene test set.
琛?5EndoScene娴嬭瘯闆嗕笂娑堣瀺瀹為獙鐨勫畾閲忚瘎浼扮粨鏋溿€?/p>
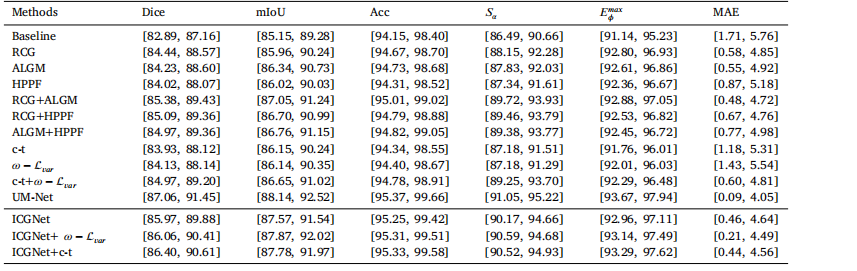
Table 695% confidence intervals for all metrics.
琛?6鎵€鏈夋寚鏍囩殑95%缃俊鍖洪棿銆?/p>
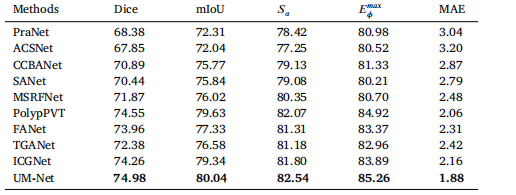
Table 7Quantitative results for a subset (C6) of the PolypGen dataset.
琛?7PolypGen鏁版嵁闆嗗瓙闆嗭紙C6锛夌殑瀹氶噺缁撴灉銆?/p>
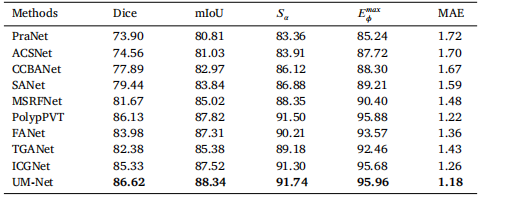
Table 8Quantitative results on CVC-300-TV dataset
琛?8CVC-300-TV鏁版嵁闆嗙殑瀹氶噺缁撴灉銆?/p>